HIGHLIGHTS 2022

Cefla celebrates its
90th ANNIVERSARY

1,802
Cefla employees in 2022

13%
Increase in
ECONOMIC VALUE GENERATED (compared to 2021)

6,454 Gj
of self-produced energy in 2022 via photovoltaic and cogeneration systems

SCOPE 2 indirect emissions
reduced by nearly 7%

About
€ 12 million
invested in R&D
+27% compared to 2021

STRIVING FOR SUSTAINABILITY
As a cooperative, one of Cefla’s inherent goals is to ensure the company is handed over securely to future generations. One of Cefla’s distinguishing characteristics lies in its economic sustainability: the statute states that at least 50% of balance sheet profits must be ploughed back into the company, a reliable way of steadily increasing the company’s net assets in keeping with its mission of creating value over time.
Sustainability is an increasingly important goal, one that Cefla aims to achieve by integrating the logic, content and tools that are vital to corporate and organizational procedures. Cefla has, in fact, nominated an internal Sustainability Manager and a Sustainability Team, a group coordinated by the Sustainability Manager, whose specific remit is to pursue ESG goals.
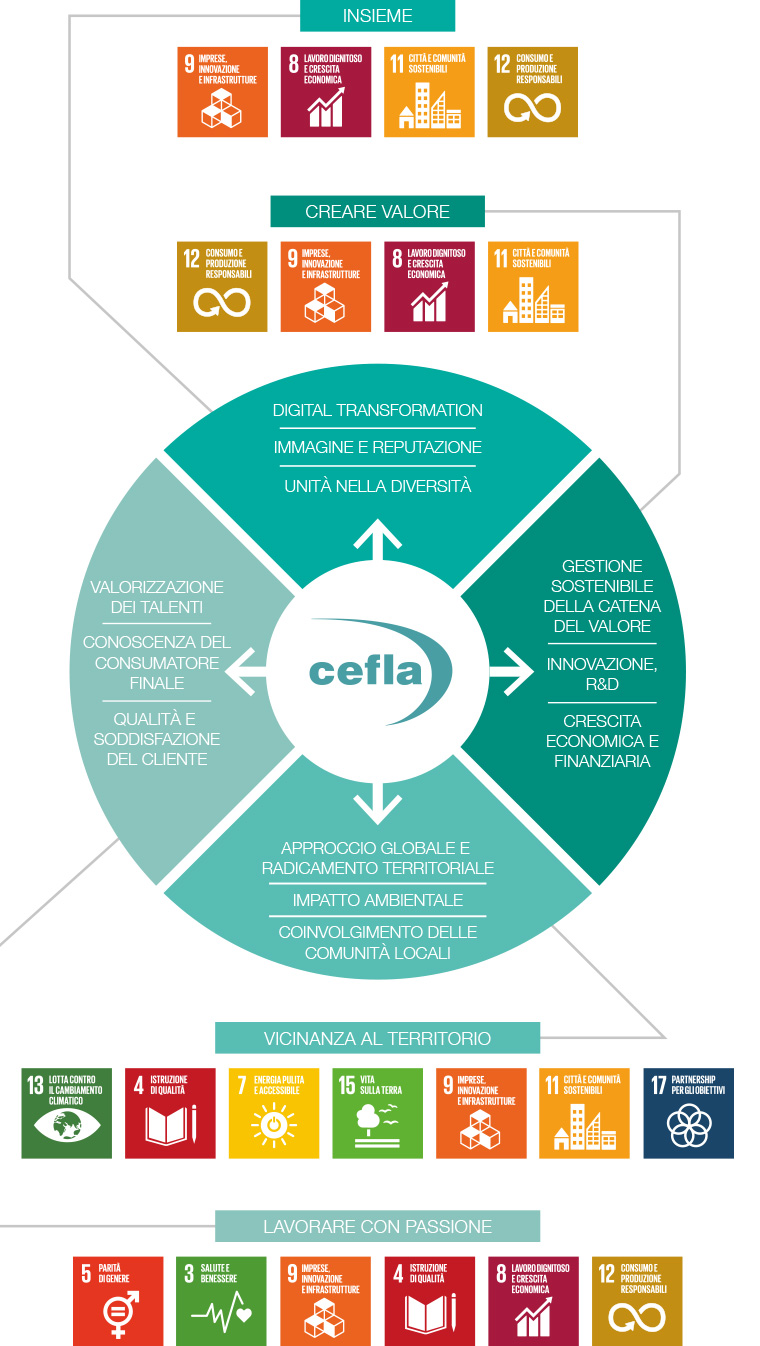
By involving the various company departments, Cefla has taken steps to share its strategic sustainability-related priorities and has defined the goals, tools and areas of action requiring intervention. Within each of the key pillars – Governance, Supply Chain, People, Environment, Community – actions have been selected to offset the expected generated impacts and comply with strategic guidelines. Following systematization of the results and an internal review process, Cefla has drawn up its own three-year sustainability model which summarises the main initiatives that fall within the scope of ESG objectives.
INNOVATION, RESEARCH & DEVELOPMENT:
In 2022, Cefla’s research, development and innovation activities were developed on a sector by sector basis, to the advantage of both the industrial-oriented Business Units and the Engineering Business Unit. For 2022, costs incurred for research, development, innovation, functional/aesthetic product improvements, product range expansion, process re-engineering, digitalization and the assessment of new businesses amounted to 11.9 million euro (about 27% more compared to investment in 2021) of which 95% regarded Cefla S.C., mainly in relation to the following projects:
| INVESTMENT IN INNOVATION, RESEARCH & DEVELOPMENT | |||
|---|---|---|---|
| 2020 | 2021 | 2022 | |
| R&D investment | 10.7 M | 9.5 M | 11.9 M |
| Innovation/Revenues | 2,3% | 1,6% | 1,8% |
| (Innovation/Innovation Y-1)-1 | 10,8% | 12,1% | 26,6% |
HUMAN RESOURCES
Attention to our people, their training and professional growth, wage strategies and a sharp focus on involvement were all deemed to be essential when Cefla’s HR policy was defined and updated.
On 31st December 2022, the Cefla Group workforce consisted of 1,802 employees. In 2022 approximately 78% of the company workforce was male: this is in line with gender distribution averages in the industries in which Cefla operates, where men are traditionally employed to a greater extent than women.
Moreover, more than 83% of all personnel (1,501 employees) work in Italy.
COMPANY WELFARE
The Group also believes that investing in personnel-focused work-life balance and welfare policies is crucial: not just in terms of corporate social responsibility but also with a view to strengthening the link between employer and employees, enabling the latter to perform their professions while ensuring maximum productivity.
With regard to health care, all non-probationary employees of the Parent Company and the Italian subsidiaries are provided with health coverage.
Initiatives implemented to provide employees with various forms of supplementary healthcare are not, however, the only corporate welfare projects launched by the Group in recent years. For example, other key programmes being implemented by the Group include:
| WELFARE INITIATIVES – FULL-TIME WORKERS | |||
|---|---|---|---|
| 2020 | 2021 | 2022 | |
| Life insurance | 151 | 147 | 175 |
| Health assistance | 1,638 | 1,467 | 1,683 |
| Invalidity/disability coverage | 746 | 701 | 721 |
| Maternity/paternity leave | 1,639 | 1,469 | 1,614 |
| Pension policies | 1,582 | 1,413 | 1,658 |
ENVIRONMENTAL RESPONSIBILITY
Cefla S.C. prioritises respect for the environment and energy savings. Hence its pursuit of key goals, such as:
CREATING VALUE WITHIN THE LOCAL COMMUNITY
Economic value generated and distributed are key items on the income statement as they highlight the value created by the organisation as a result of its daily operations.
The consolidated financial statements of the Cefla Group as of 31 December 2022 show Revenues and EBITDA are at the highest levels ever achieved by the Group: Revenues amounted to 650 million euro (+13.3% compared to 2021), while EBITDA was up to 91 million euro (+32.9% compared to 2021). Net Profit was €61 million (+22.2% on 2021).
The Group’s capacity to relate to stakeholders within its local area is of paramount importance to sustainable economic performance.
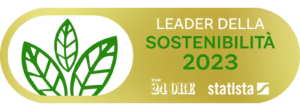
Leading Italian financial newspaper Il Sole 24 Ore lists Cefla as one of the “Sustainability Leaders 2023”. This is a list of the 200 most sustainable Italian companies, all of which have reported progress in parameters relating to the three main areas of sustainability: environmental, social and economic.


